XRT/graph: 2D グラフ機能を構築するウィジェット


XRT/graph は、棒グラフ、X-Y プロット、円グラフ、面グラフ等の基本的な 2D グラフを始め、ビジネス、統計、科学技術等、幅広い分野のグラフが作成できるパワフルな Motif ウィジェットです。 グラフの表示や動作は、200以上のリソ-スを用いて簡単にコントロ-ルすることができます。
グラフのデ-タ
あらゆるソ-スのデ-タをグラフ化できます。 Cのデ-タ構造体の割り当て、操作やテキスト・ファイルからデ-タを読み込む関数が用意されています。 また、デ-タの欠損値"hole"も処理できます。
グラフの種類
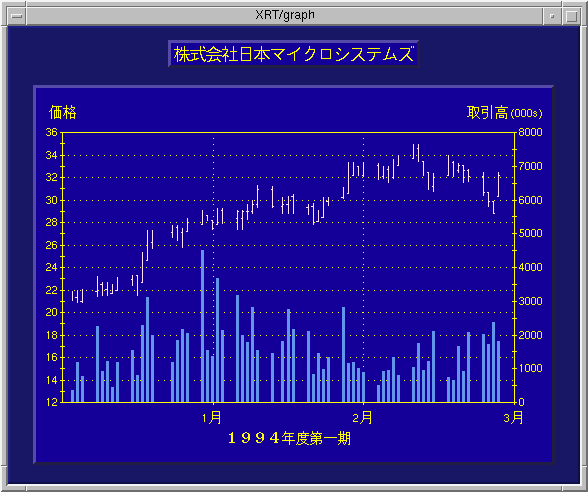
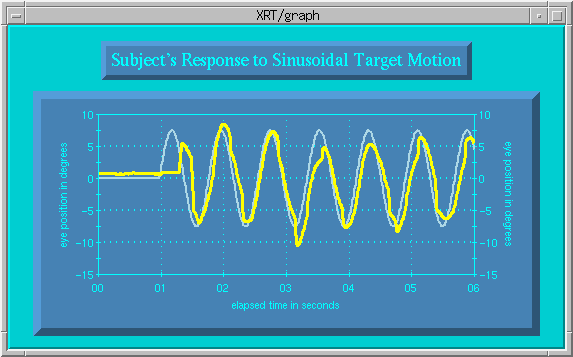
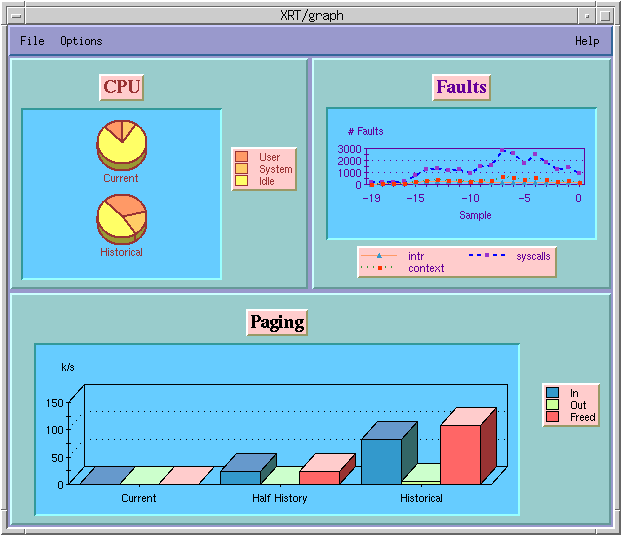
基本的なグラフのタイプは、線グラフ、面グラフ、棒グラフ、積み上棒グラフ、円グラフ、hi-low、キャンドル、ポ-ラ-、レ-ダです。 二つのグラフを組み合わせて複合グラフも作成できます。リソ-スを操作することにより、基本タイプから多くのバリエ-ションを作成できます。 棒グラフ、円グラフは 3D 表示が可能で、グラフの奥行きや傾き、回転はリソ-スによって設定され、ユ-ザはこれらをインタラクティブにコントロ-ルすることができます。 デ-タを表示する線やポイントには多くのスタイル、サイズ、色がサポ-トされ、これらを利用して、スキャッタ-・プロット、ストリップ・チャ-ト、ベクトル・チャ-ト、インパルス・チャ-ト等が作成できます。
グラフの構成
軸
X軸、Y軸の最小値、最大値、原点、精度、目盛ラベル、目盛印、格子の増分等のデフォルト値はデ-タから自動的に計算されます。 軸の注釈には、会計、通貨、パ-センテ-ジ、指数等のフォ-マットが用意されています。 また、対数軸や時間軸、二本のY軸もサポ-トされています。
ヘッダ-とフッタ-
複数行のヘッダ-とフッタ-テキストが左、右、中央揃えに設定できます。テキストはデフォルトで最適の位置に配置されます。
テキスト領域
複数行のテキストをデ-タ、またはピクセル座標に幾つでも貼り付けることができます。テキストは領域内で行揃えできます。
凡例
凡例は水平または垂直に表示でき、アンカ-を使用して位置を決めることができます。
リアルタイム・アップデ-ト
XRT/graph で作成されたグラフは描画が瞬時に行われますので、科学、金融、ネットワ-ク・モニタリング等、刻々とデ-タが変化するリアルタイム・アプリケ-ションに対応します。 デ-タに適するようグラフの軸のスケ-リングは自動的に行われ、高速アップデ-ト機能を利用して新しいデ-タも即座に表示できます。
ユ-ザ・インタラクション
ズ-ム、スケ-リング、移動、回転
グラフは、マウスを用いてインタラクティブにズ-ム、スケ-リング、移動、回転が行えます。 この機能はウィジェットに組み込まれており、デフォルトのアクションは、エンドユ-ザが自由にカスタマイズすることもできます。
フィ-ドバック
XRT/graph には、ユ-ザのマウスイベントの位置を的確に知らせるフィ-ドバック・ル-チンが提供されています。 map( )はマウス・イベントをグラフ座標に対応させ、pick( )はどのデ-タがマウス・イベントに一番近くに位置するかを決定します。
プロパティ・エディタ
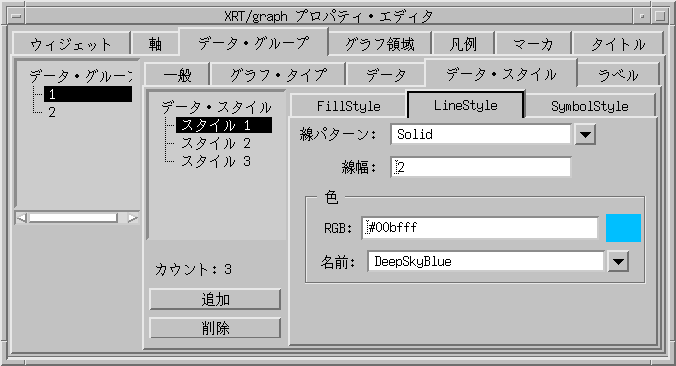
XRT/graph には、ポイント&クリックでグラフを定義し、その結果をすぐに確認できるプロパティ・エディタが装備されています。 グラフの設定はファイルに保管され、C コ-ドまたはリソ-スファイルが自動的に生成されます。 このプロパティ・エディタは、別のライブラリとしてソ-スコ-ドも提供されていますので、必要に応じてカスタマイズすることができます。
その他の機能
ダブル・バッファリング、K&R C/ANSI C/C++バインディング、リソ-ス逆変換プログラム
XRT/graph ではあらゆる種類のグラフを作成することができます。ここをクリックすれば、その他のグラフの例を見ることができます。